Wednesday, June 4, 2014

AC Circuits

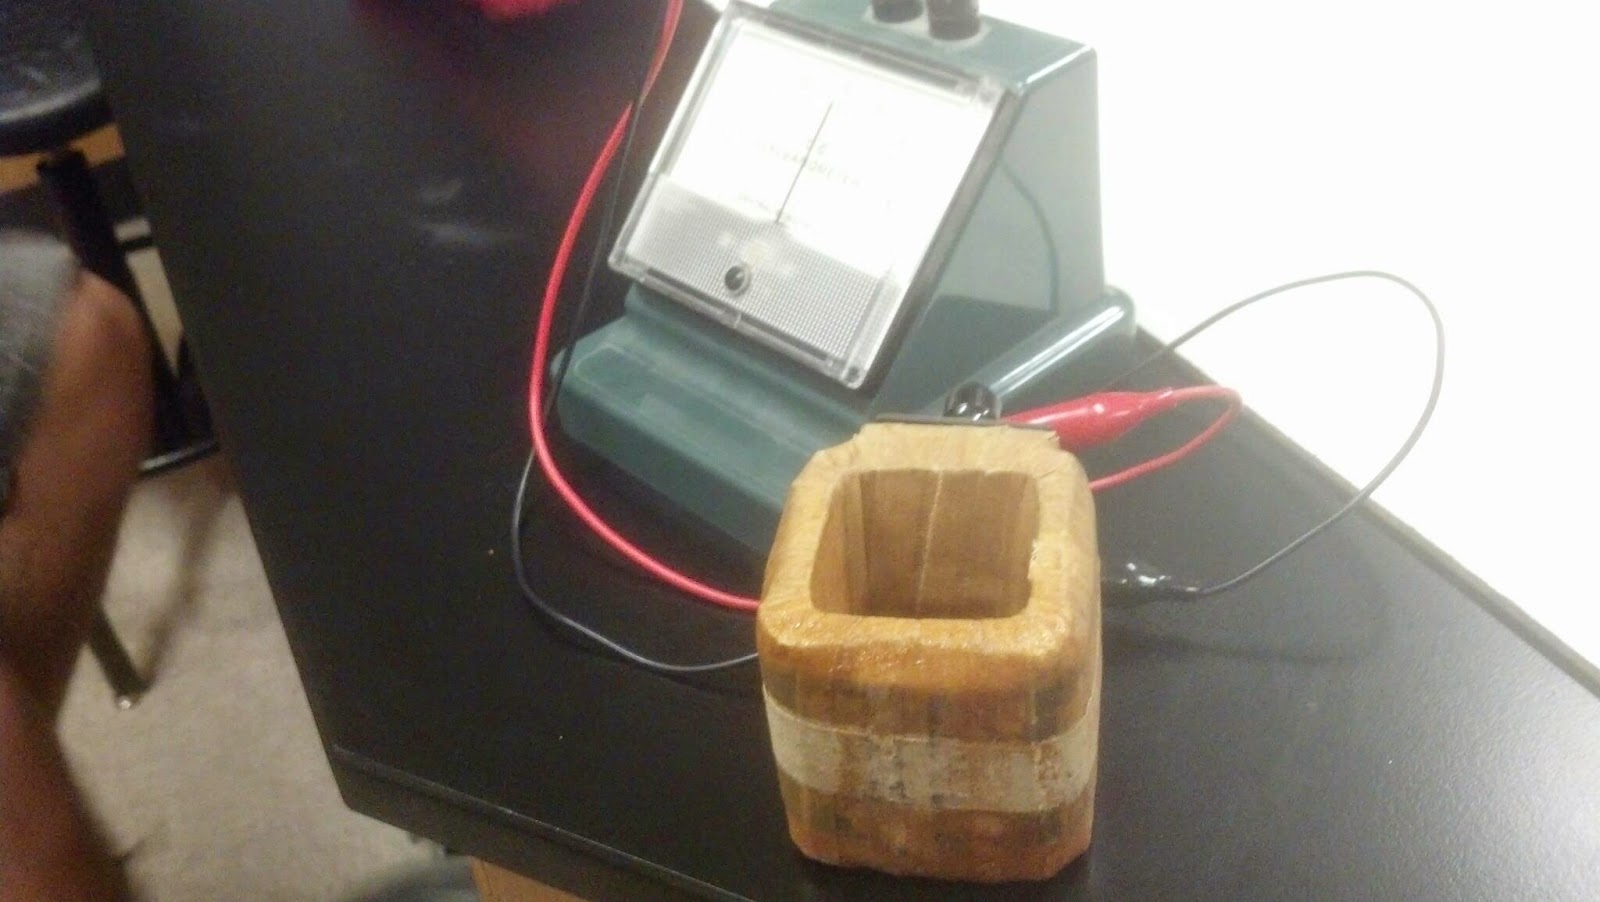
     I am not exactly sure what was in this box, but this is the setup for a demonstration Professor Mason performed in class on Monday. The purpose of the demonstration was to show a particular difference between DC voltage and AC voltage. Initially, one half of the box was lit up through a 3 volt DC power source and the other half through a 3 volt AC source. The side lit up by the DC source was much brighter. The sides of the box were not equally as bright until the AC source was turned up to around 4.6 V AC, which is roughly 3 volts RMS. 
 
     In lab, we conducted an experiment in which we calculated a theoretical capacitive reactance and then used current and voltage sensors to construct graphs using LoggerPro that would be used to determine RMS voltages and currents. These voltages and currents would be used to acquire another value of capacitive reactance that we would compare to our theoretical value. We did this for two different capacitors and then found that doubling the frequency greatly reduced our percentage error. We attempted a similar process with an inductor, but found that our results we not nearly as accurate as they were with the capacitor. Also, we simply ran out of time to complete the inductor experiment in its entirety.  
 
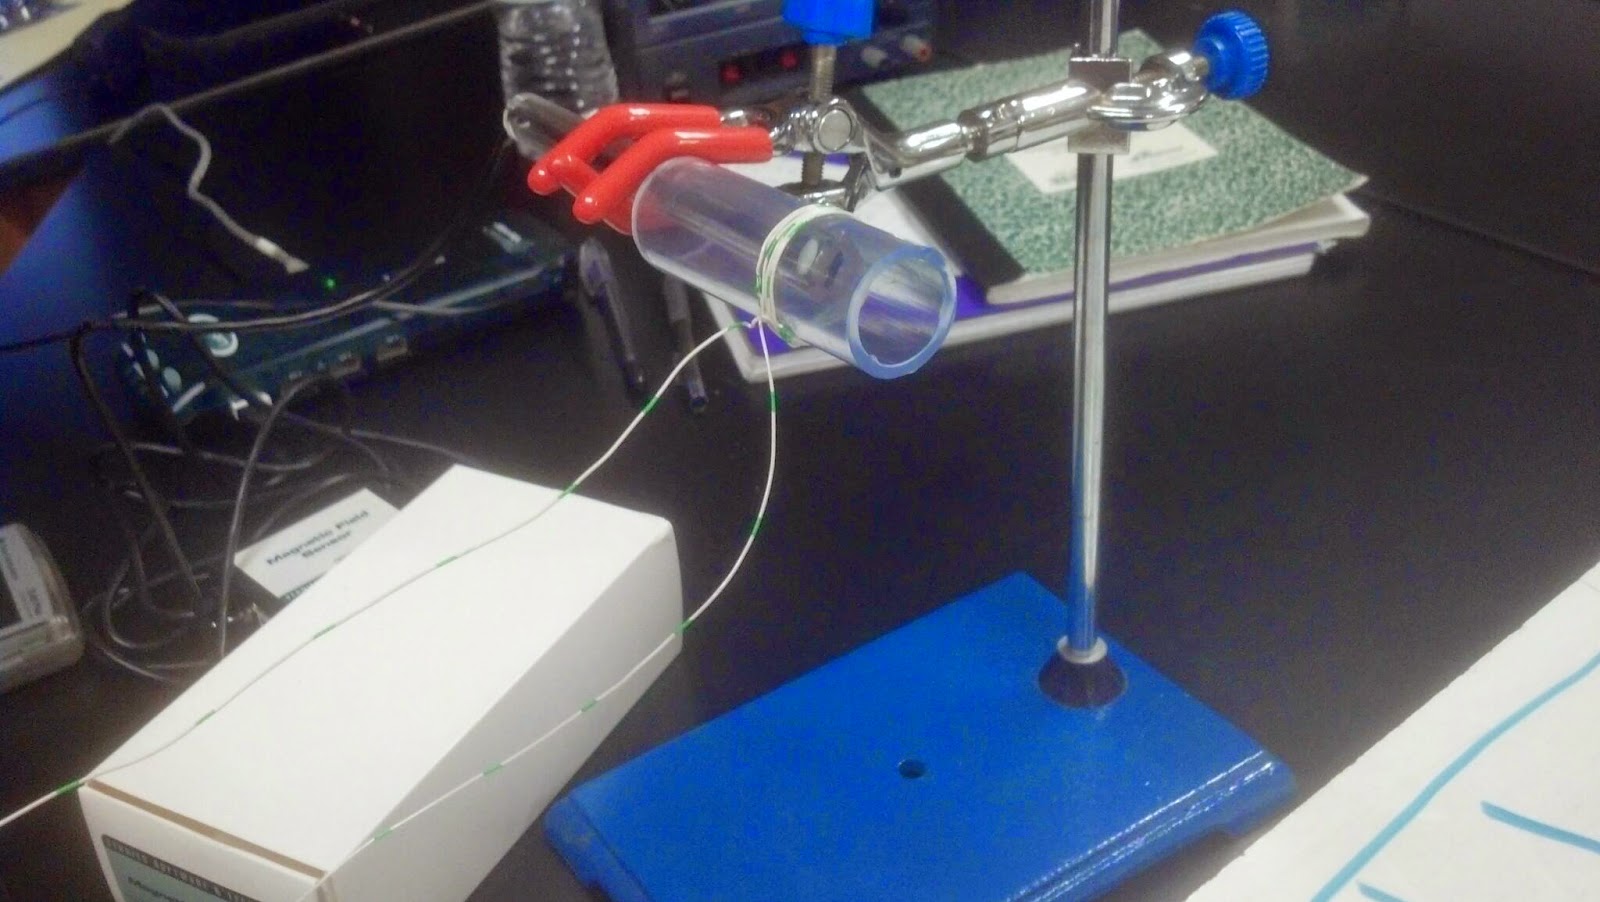
     This is a sample of the graphs we obtained through use of the voltage and current sensors hooked up into our RC circuit. In order to obtain RMS values for voltage and current, we simply took the maximum value and divided it by the square root of two. We then divided the RMS voltage by the RMS current, which gave us a value of reactance. 

Monday, June 2, 2014

Induction

     In addition to answering a number of questions on the ActivPhysics website on Wednesday, we conducted in an experiment in which we were to determine the inductance of the coil in the above picture. We calculated the inductance by using the dimensions of the coil and also by using the oscilloscope to estimate the half time of exponential decay. 
     The answer in the box is the actual inductance that Professor Mason measured while the larger value is the value we came up with using the half time of exponential decay. As one can see, our calculation was not very accurate. 
 
     This is the calculation of the coil's inductance using the dimensions of the coil. It is much closer to the true value than the previous calculation. 

Thursday, May 22, 2014

Electromagnetic Induction

     On Monday, we measured the magnetic field of a current carrying loop with multiple loops. This is a picture of our setup. 
     This is a table of the values we measured during the experiment. As one can see, the values of the strength of the magnetic field were not very reliable because of the orientation of the sensor. The values to the very right are values measured by Professor Mason. 
     Using Professor Mason's values, we determined a constant for the value of B/NI and used that constant to calculate the length of the coil of wire. 
     We were also given a coil of wire on Monday and connected it to a galvanometer  in order to experiment with electromagnetic induction. We used a bar magnet in this experiment and found that factors such as the number of coils and the velocity in which we moved the magnet in and out of the coil contributed to the amount of current we measured.
     This is a demonstration performed by Professor Mason in which a current was given to a driver coil and a current was induced inside the smaller coil. We observed that the voltage induced in the smaller coil was smaller and 180 degrees out of phase with the voltage that was supplied to the driver coil.

Friday, May 16, 2014

Biot Savart Law

     The first thing we did in class on Wednesday was learn how to derive an expression for a magnetic field at a point a distance from an infinitely long wire. We then used that technique to come up with an expression for the magnetic field at a point in the center of a square made from four current carrying conductors. However, I think I may have made  an error in my calculation. 
 
     We also came up with an expression for the magnetic field at a point in the center of a current carrying loop. This expression was much simpler to come up with. 
 
     This is a picture of the setup of an experiment we conducted in which we were to approximate the horizontal component of the earth's magnetic field in the Physics 4B room.  We applied a small amount of current to the coil, recorded the angular displacement of the compass needle, and calculated the magnetic field in the center of the coil. We then made a graph of the magnetic field vs. angular displacement. The slope of this graph would be our approximation of the component of the earth's magnetic field which we were to determine.
     These are the calculations for the magnetic field at the center of the coil. We used these values as the four data points in our graph.
 
     This is the graph we ultimately came up with after conducting the previously described experiment. According to the graph, the component of the earth's magnetic field which we sought was on the order of 2.8*10^-5. Was this correct? I haven't the slightest idea, but it was very similar to values that other groups came up with. 
     The very last thing we did in lab was calculate the strength of the magnetic field at the center of a solenoid and compare it to the value that Professor Wolfe measured. The values were surprisingly close considering the "solenoid" used in the demonstration. 
 

Wednesday, May 14, 2014

DC Motors and Magnetic Fields from a Current Carrying Wire

   Because of a terrible internet connection at Mt. SAC, this is my THIRD time publishing this same post. Please excuse the fact that I lost my patience, and it is not as detailed as it originally was.    
     We were given a simple DC motor in order to observe how it worked before we were to construct our own.
 
     This is the simple DC motor that we constructed in lab. It worked very well actually. 
  
     In this demonstration, there was a current running through the rod, and we were to predict which direction the needles of the compasses would point. Of course, there is a right hand rule for such a prediction.
      
     This is an example of a prediction for the previously described demonstration. 
     This was a demonstration to show that magnetic fields caused by a current carrying wire do superimpose. 

Monday, May 12, 2014

Magnetic Fields and Forces

     The first thing we did in lab on Wednesday was observe the behavior of a compass when it was placed in proximity of a bar magnet. The arrows drawn on the whiteboard represent the direction of the red portion of the compass needle as it was moved in a circle around the magnet. The purpose of doing this was to get an idea of what a magnetic field looks like. 
     This is a more accurate depiction of what a magnetic field actually looks like in two dimensions. Iron shavings were placed around the bar magnetic, and they arranged themselves in the pattern shown. The field lines are nearly linear as they leave the north pole of the magnet and curve around the length of the magnet before straightening out again as they reenter the south pole. 
     This picture shows three different enclosed surfaces drawn around certain points of the magnetic field. The surface drawn to the left and the surface surrounding both poles have a net flux of zero because the same amount of field lines enter them as do exit them. The surface containing only the south pole does have a net flux of 10. However, it is important to note that a monopole magnet does not exist in nature. 
 
     These are the calculations performed to find the strength of the magnetic field in an experiment that I should have taken a picture of.  Essentially, the experiment consisted of a magnetic force created from a current running through a wire and a magnet and a hollow copper rod that rolled off a platform upon experiencing the force. All of the measurements we needed are written down toward the lower right hand corner of the white board. The final equation we derived to calculate the strength of the magnetic field is shown in green, and the answer we came up with was roughly .0207T, which seems reasonable.
     There was also another demonstration which I neglected to take a picture of. This demonstration consisted simply of a magnet and a wire with a current running through it, and we were supposed to predict which direction the magnetic force would cause the wire to move in.
 

Wednesday, May 7, 2014

Amplifier Circuits

     This is the schematic for a simple transistor audio amplifier circuit which we were to construct during our lab on Monday.
      This is a picture of the actual circuit which was constructed from the schematic at the beginning of this post.
     This is what we measured from the previously posted circuit using an oscilloscope. The sinusoidal function is the input from the function generator, and the wave form that is clipped on the top is the actual output of the transistor circuit.

     We also constructed another amplifier circuit in lab that used an IC and was much simpler than the previous circuit. We hooked up a phone to provide an audio signal as an input and used a speaker as the output device. The circuit worked, and the signal was indeed amplified.